The starting point
Merchants had reports. The experience had room to grow.
When I joined Delivery Hero, Performance reporting was part of my remit, and one of the product's lowest-scoring areas for customer satisfaction.
The section was limited and largely table-based: merchants chose from a list of reports for performance, order details, hourly revenue and other views. It provided access to data, but left room to make that information easier to understand and use.
The opportunity was a business performance experience that helped merchants assess how their stores were doing, understand the context, and identify useful next steps.
What changed for merchants
An overview they could read at a glance
Instead of starting with a list of report destinations, merchants could start with a view of their business.
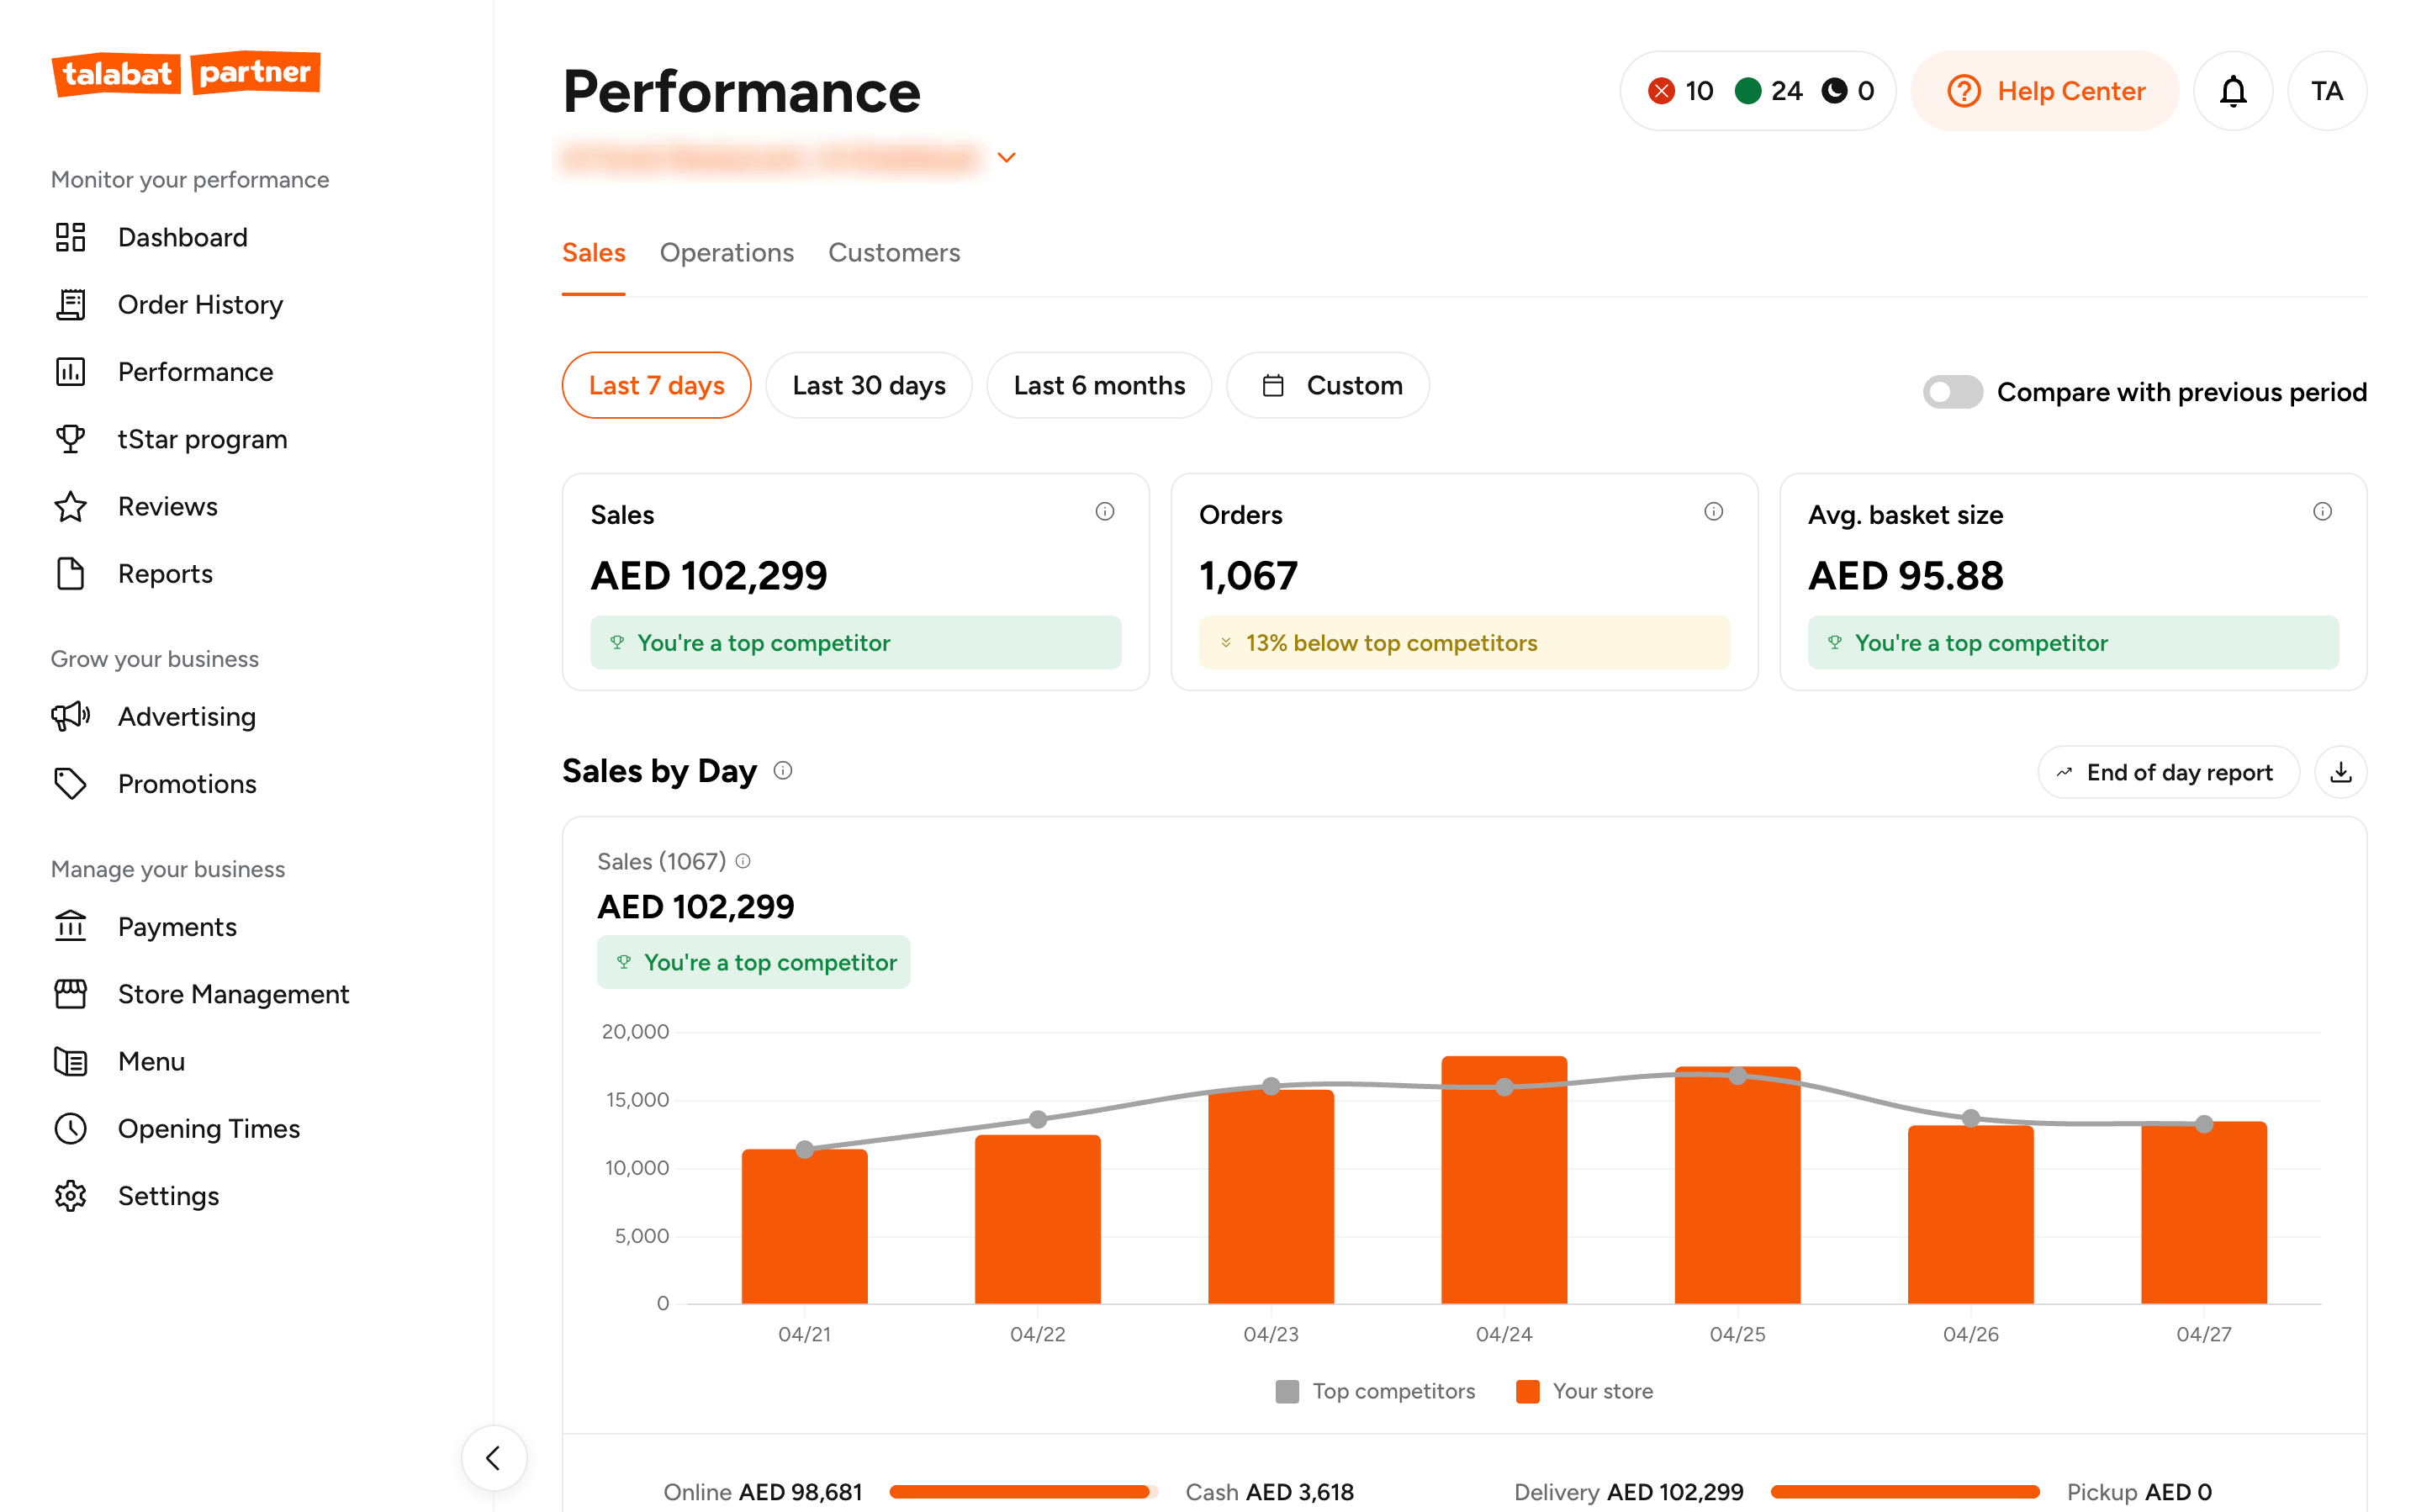
The landing page became a performance overview: sales, orders and average basket size together, with date controls, charts and comparisons in the same experience.
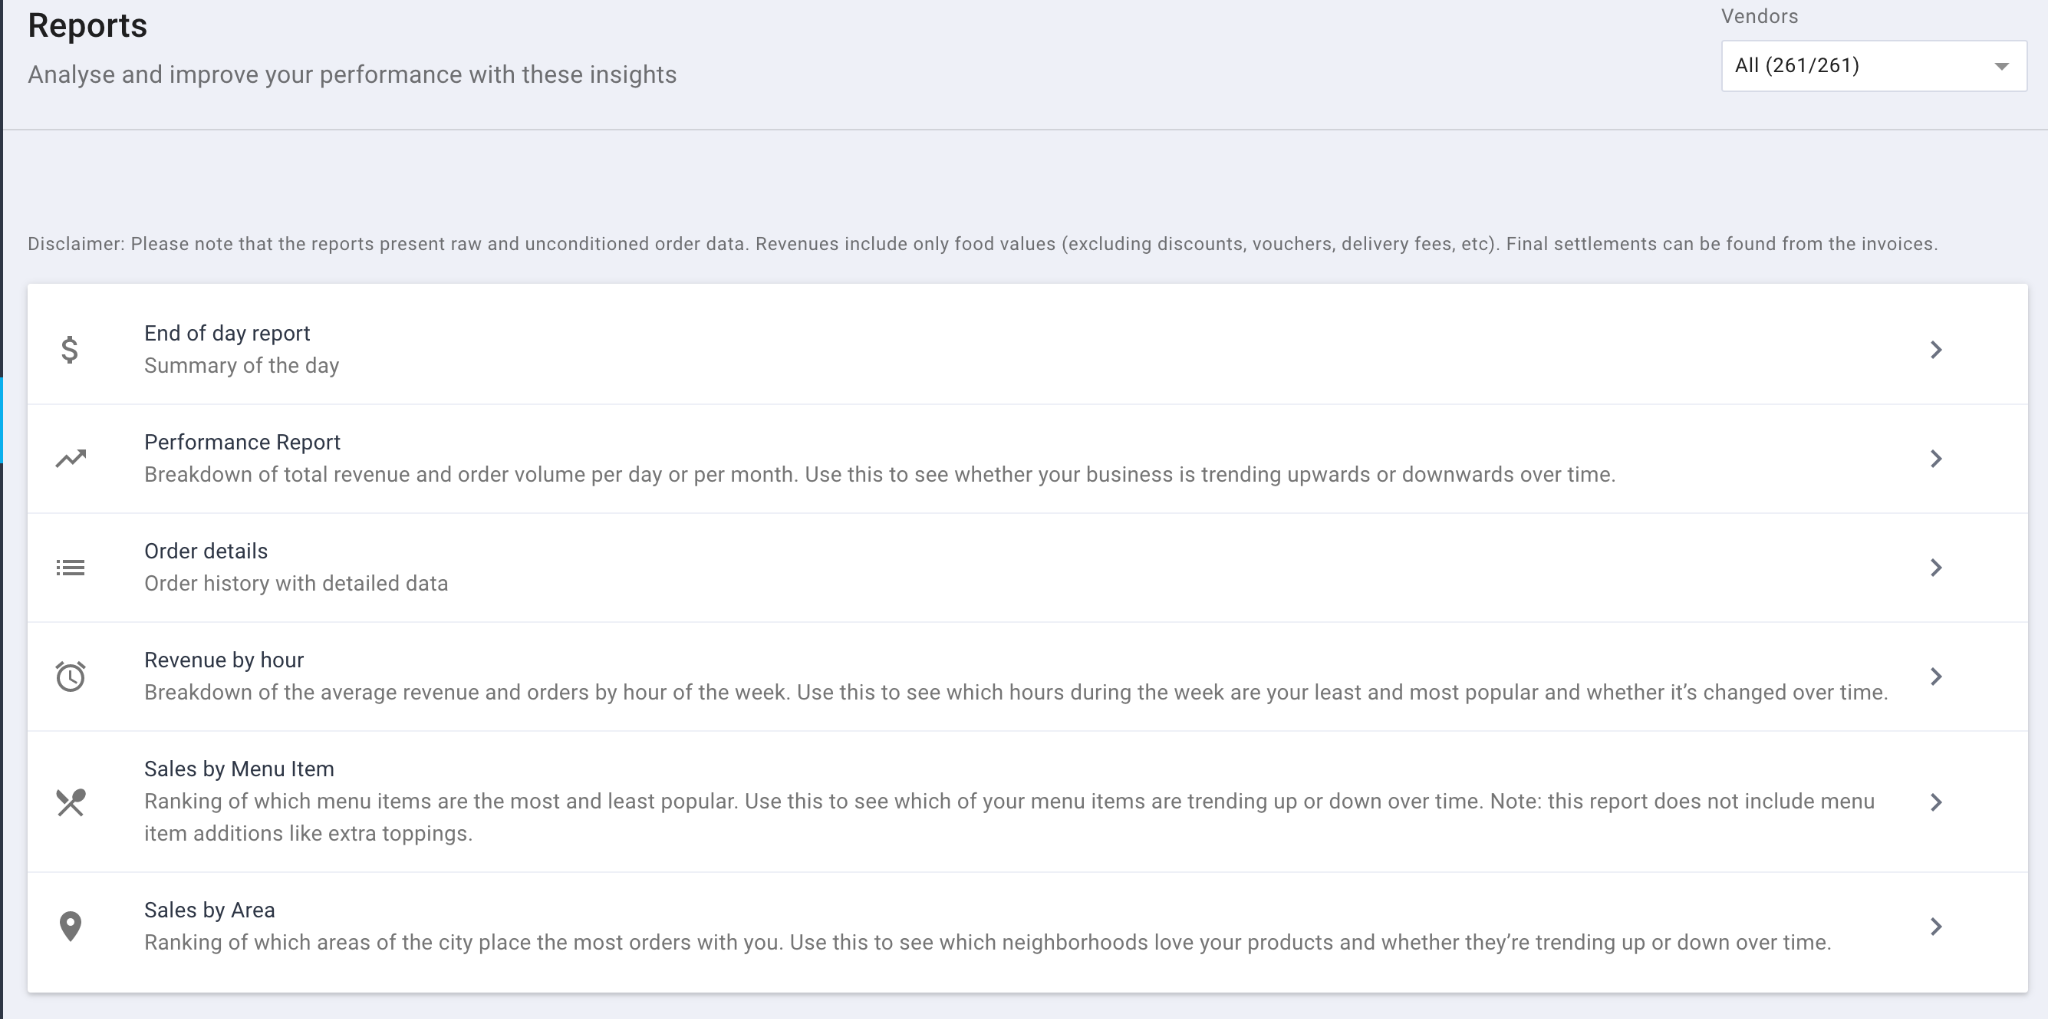
A list of separate reports and limited reporting views.
A performance overview bringing key figures, charts, and comparisons together.
Sales & orders, with market context
Context around the numbers
Market-based comparisons showed merchants their performance alongside similar businesses, with an explanation of how competitors were selected.
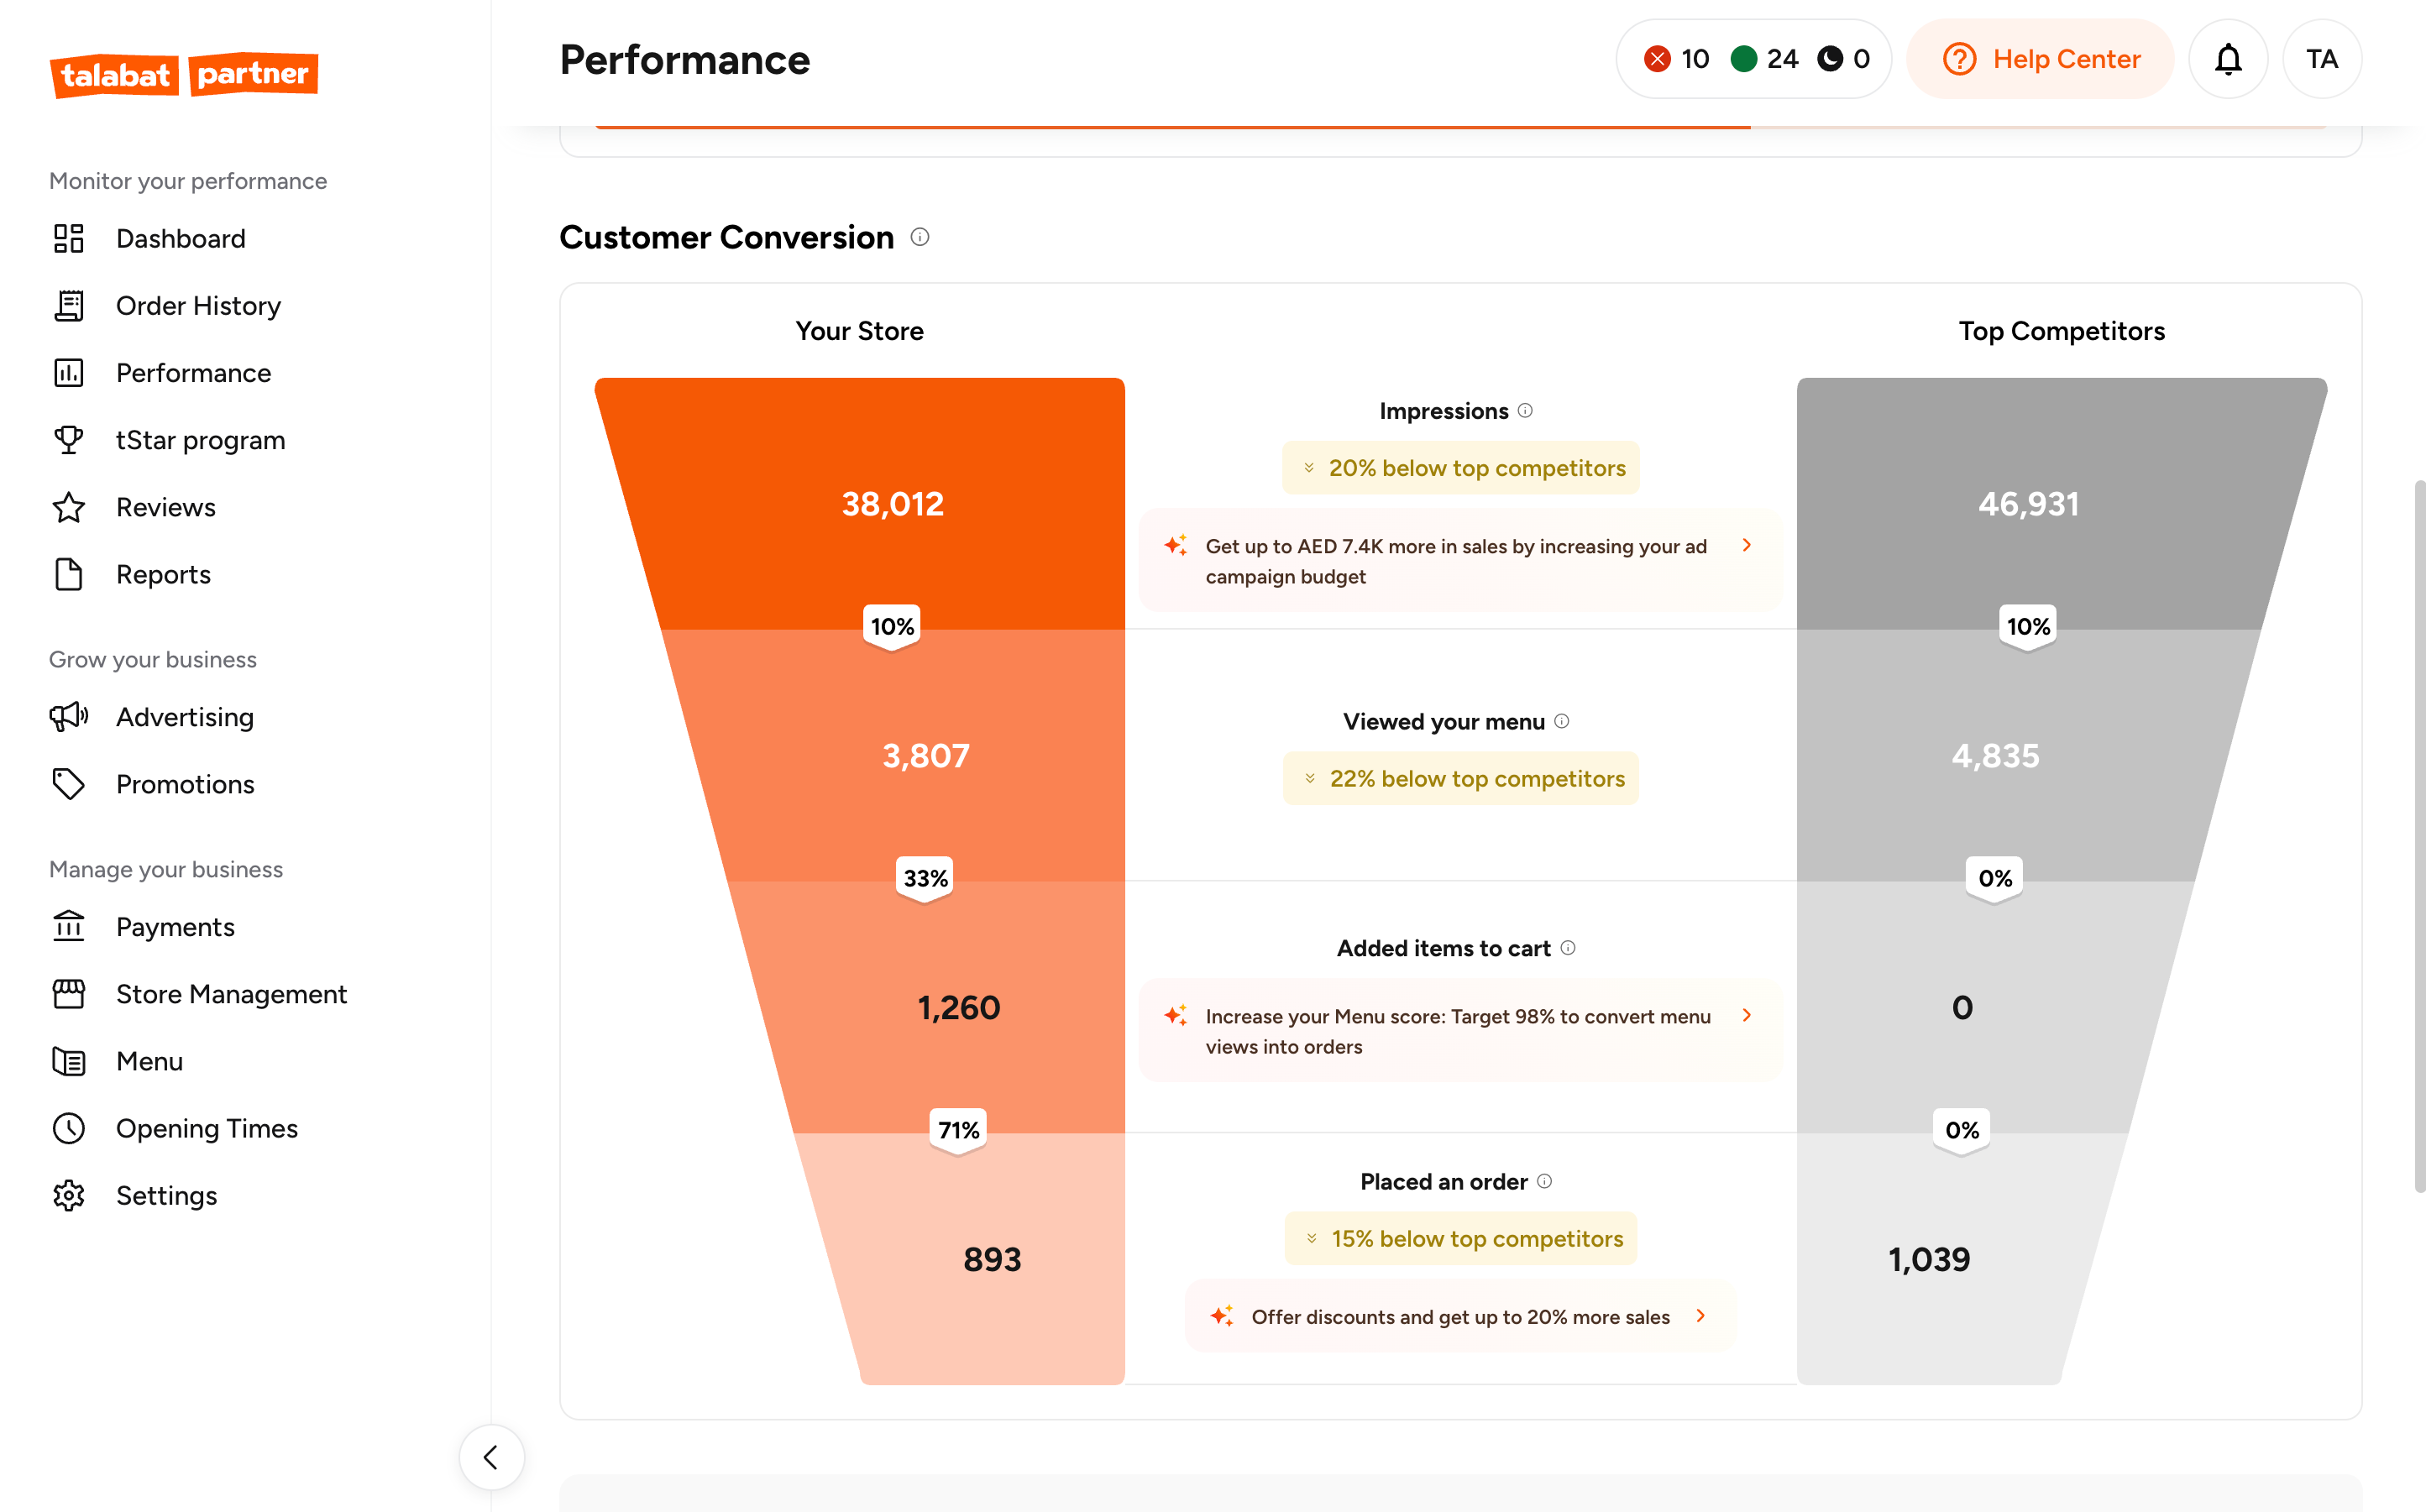
Conversion views broke the customer journey into stages, from seeing a store to placing an order, with recommendations alongside those stages to connect what merchants saw with possible actions.
More useful detail
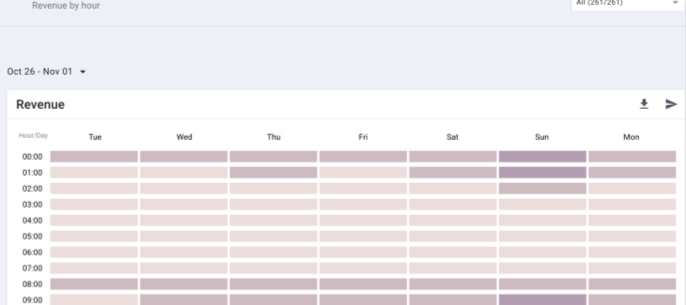
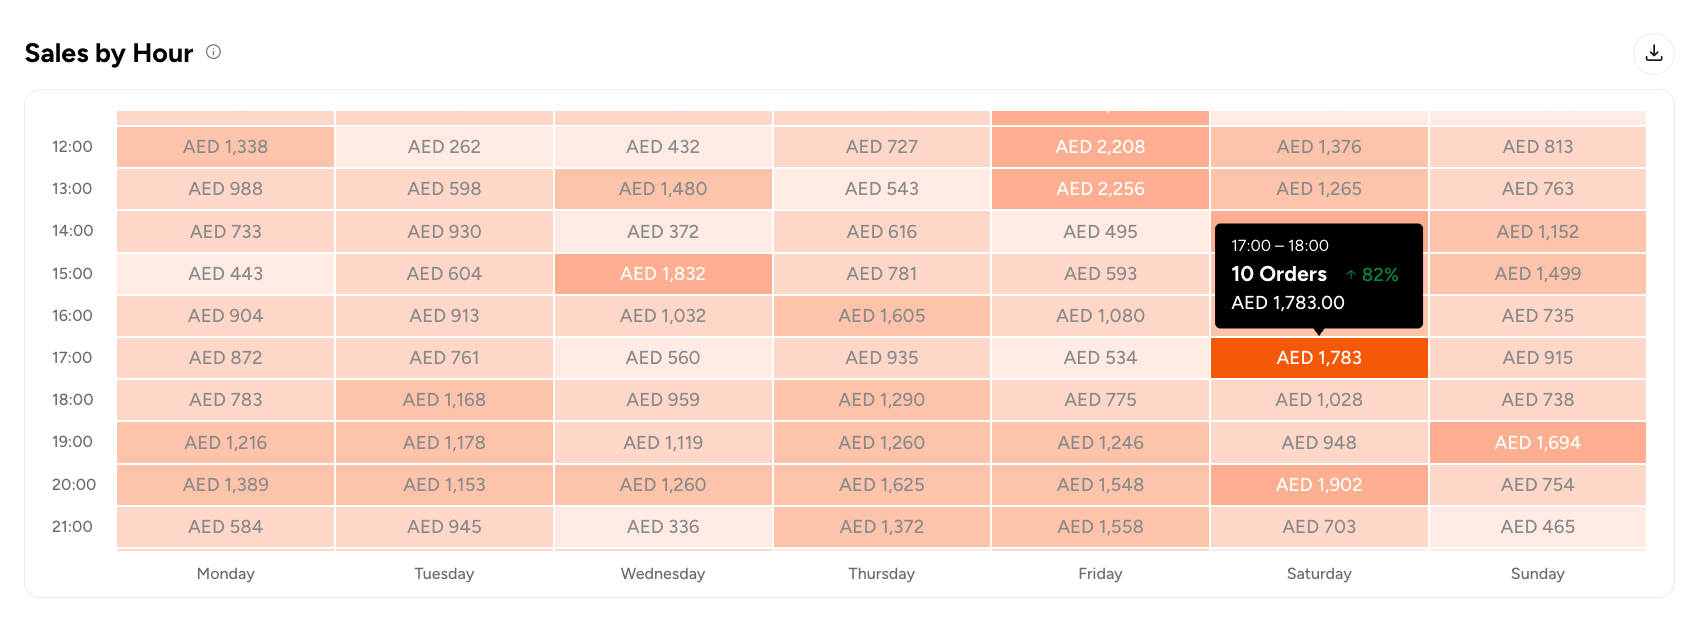
The section grew to include clearer performance charts and AI-driven insights. Even small interactions changed: the earlier hourly revenue heatmap had no hover state, while the later view exposes values and comparison information for each time slot.
Earlier
Later
Results
Higher satisfaction and adoption
Store-performance satisfaction rose from 46% to 56% (+10 percentage points, Q4 2023–Q1 2026).
Performance reporting sat within a wider merchant portfolio: the dashboard, order history, reviews, payments, rewards and more.
Across six product sections I owned there, average adoption grew from 37.3% to 77.1% (+39.8 percentage points) between April 2023 and January 2026.
These measurement windows cover part of a longer product journey and describe the work of the team. The ~€30M estimate belongs to Smart Recommendations; the satisfaction and Reports adoption results describe Performance reporting.
Let's talk about your teamMy role as the product grew
For roughly two to three years I owned this work hands-on as an individual-contributor PM, then handed it to PMs I managed, who kept developing it under my guidance.
A former manager's perspective
He managed to develop a great and compelling product vision for a critical part of our vendor offering, get alignment from stakeholders all over the world, rally his teams around it, and deliver with them amazing results for the company... all in a seemingly effortless way.